After last week’s explanation of how candlesticks are formed and how to interpret them we can now explore what the most common candlestick patterns can indicate. Start analysing charts before you enter a trade, it will almost certainly pay off!
How to analyse a trend
The trend whether up or down can be demonstrated using trend lines, moving averages or other tools as part of technical analysis. It is important to consider the timeframe you are using as what seems like a trend on a 1minute chart is irrelevant if you are looking to hold your position for a few days, it would be better to look at a 30 minute chart, although this is really up to an individual.
You should use patterns found in combination with other tools to find a good trading setup.
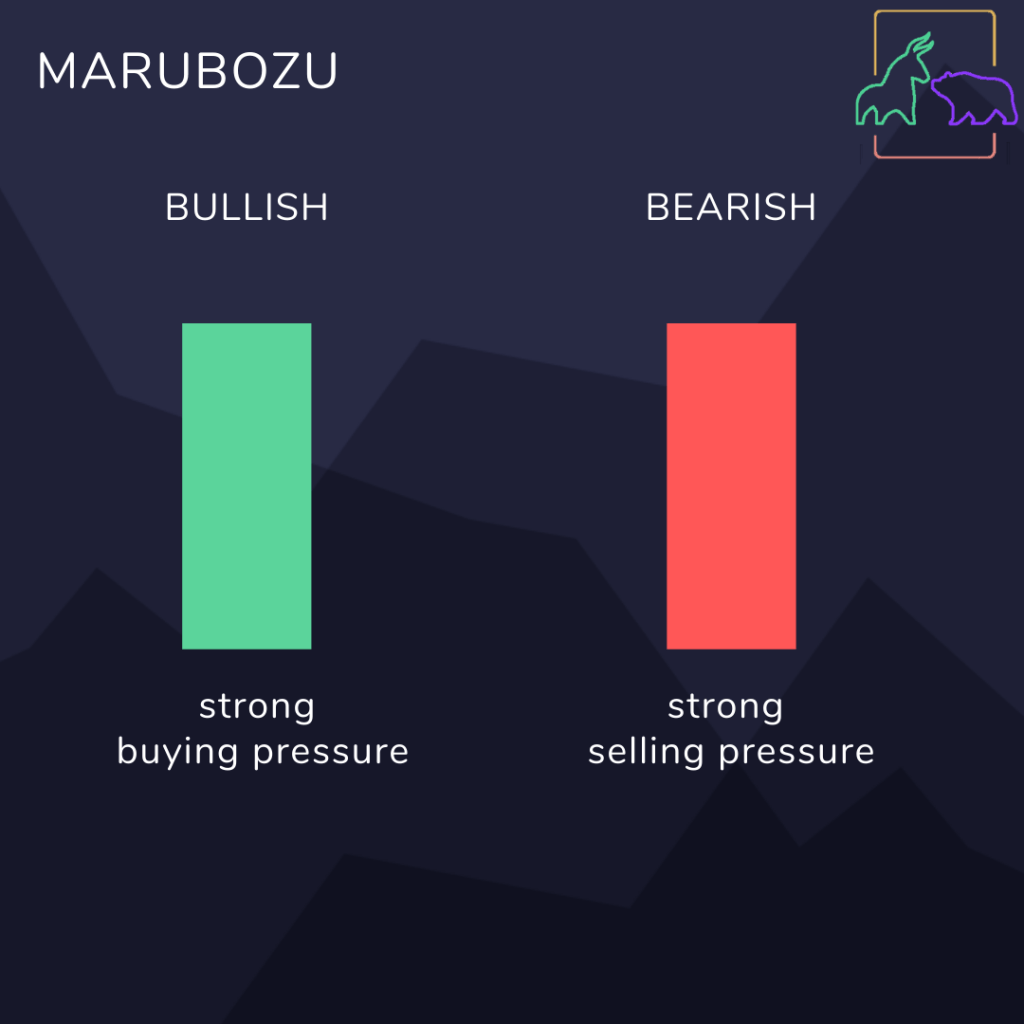
A Marubozu candlestick is a long candlestick that does not have upper or lower shadows (wicks or tails). This occurs when the low and high are inline with the opening and closing prices presenting either buyers or sellers (depending on whether the candle is green or red) exclusively are strongly in control of the price over the period. A green Marubozu forms when the open equals the low and close equals the high whereas a red Marubozu forms when the close equals the low indicating a very strong buying pressure and the open equals the high presenting a very strong selling pressure.
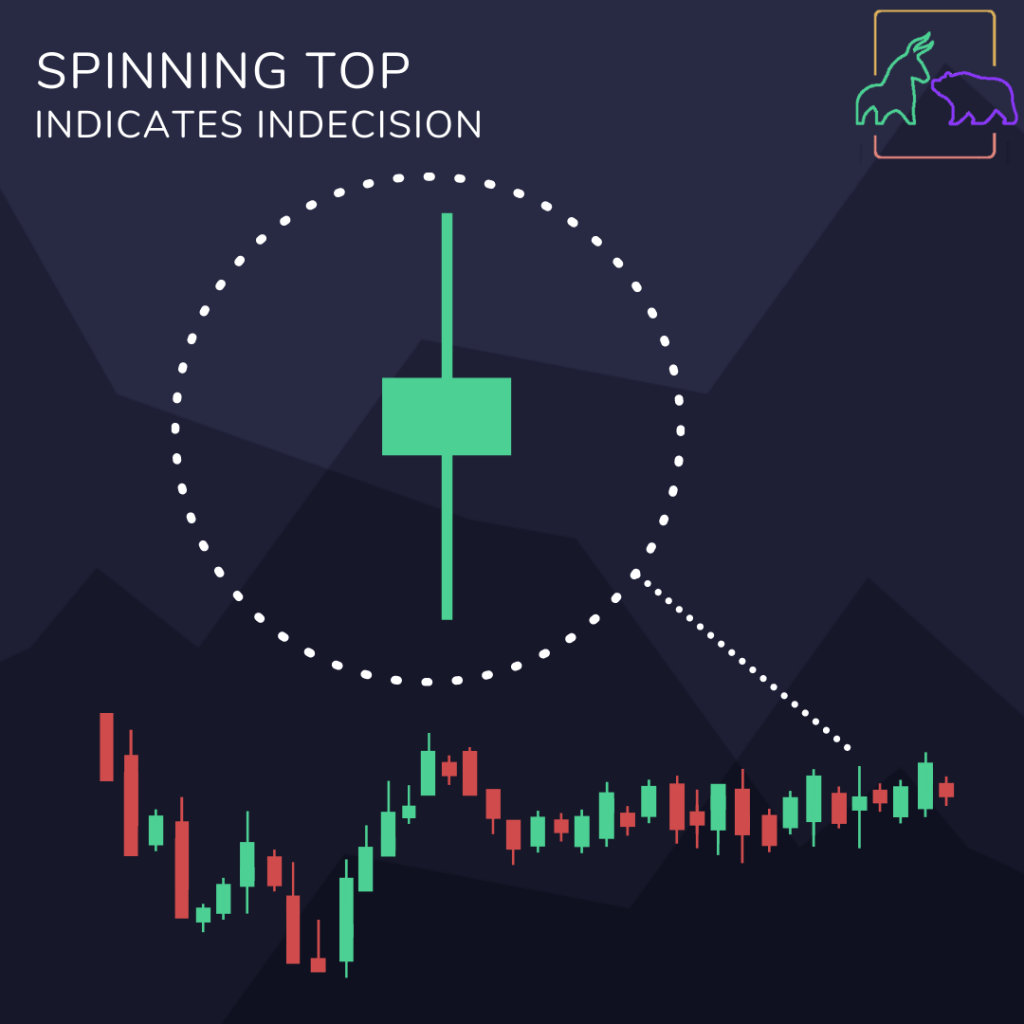
Spinning tops are candlesticks with a long upper and lower shadow with a small body. Spinning tops represent indecision as the small body represents little movement in price from open to close with the long shadows indicating both bulls and bears were active during the session. These long shadows show high price fluctuation within the period the candlestick represents despite the closing price being so near the opening price. After a long bullish or bearish trend a spinning top can show a potential change in direction either temporarily or ongoing.
A doji is another key candlestick that even analysed separately of the trend can tell you a lot of information about the markets. A doji forms when the opening price is virtually equal to the closing price giving a very thin body making the overall candlestick looking like a cross. Although an ideal doji looks has the shadows a similar length, a less robust doji can also be used to understand a market trend. If one shadow is longer than another then this could indicate that the bulls or bears might be getting their way, despite the close price not changing from the open price. You may wonder who decides how close the opening and closing price has to be to count as a doji? Well different assets have a different metric for determining the robustness of the doji depending on price, recent volatility and comparing it to recent candlesticks.

To analyse the market trend you should identify a doji within a trend, judging its position compared to the preceding candlesticks. After a long green candlestick a doji indicates buying pressure has dropped and shows a change in the trend is going to happen soon. The same applies for opposite forces where a trend of red candlesticks is followed by a doji signaling the selling pressure has weakened. A doji after an uptrend is more significant as buying pressure is required to maintain an increase in price whereas the price can fall without an increased selling pressure simply if there is a lack of buyers. Spotting a doji isn’t enough information to signal a reversal in the trend so look out for other patterns to confirm what the doji indicates. To confirm a directional change, look for a long red candlestick lower than the green candlestick.
Long-legged doji have long upper and lower shadows that are roughly equal in length. This demonstrates there is high indecision in the market as long shadows present prices traded much above and below the opening and closing price.
There are a further two types of doji that deserve special recognition. Dragonfly doji look like a capital “T” with a long stem or using the descriptors of candlesticks, no upper shadow, a long lower shadow and almost no body. This can be seen when sellers are strongly present during the trading session attempting to push down the price yet over that timeframe not achieving a move in price. A dragonfly doji can be significant after a long downtrend or at a support level to indicate a bullish reversal. Similarly after a long uptrend or at the resistance line, the presence of this doji could signify a potential bearish reversal. The opposite of a dragonfly doji is a gravestone doji which looks like an upside down “T” with a long top shadow and almost no bottom shadow. The presence of this doji indicates that buyers are more dominant pushing up prices over the session yet failing to push the closing price higher than the closing price. After a downtrend, long red candlestick or at a support line the presence of a gravestone doji indicates some buyers are active and could lead to a bullish reversal. The opposite also applies.
Candlesticks demonstrate the fight between bulls and bears or buyers and sellers. The bottom of the candlestick if the close is close to the high represents a win for the bears and the top represents a win for the bulls the closer the close is to the low. As mentioned before if there is a long green candlestick then bulls are in control with a shorter body demonstrating a weaker advantage. The reverse is also true when a long red candlestick is present. When there is a struggle you can see doji forming, with the longer the upper shadow showing bulls are more active and if the lower shadow is longer than bears are creating more pressure.
Candlestick Positions

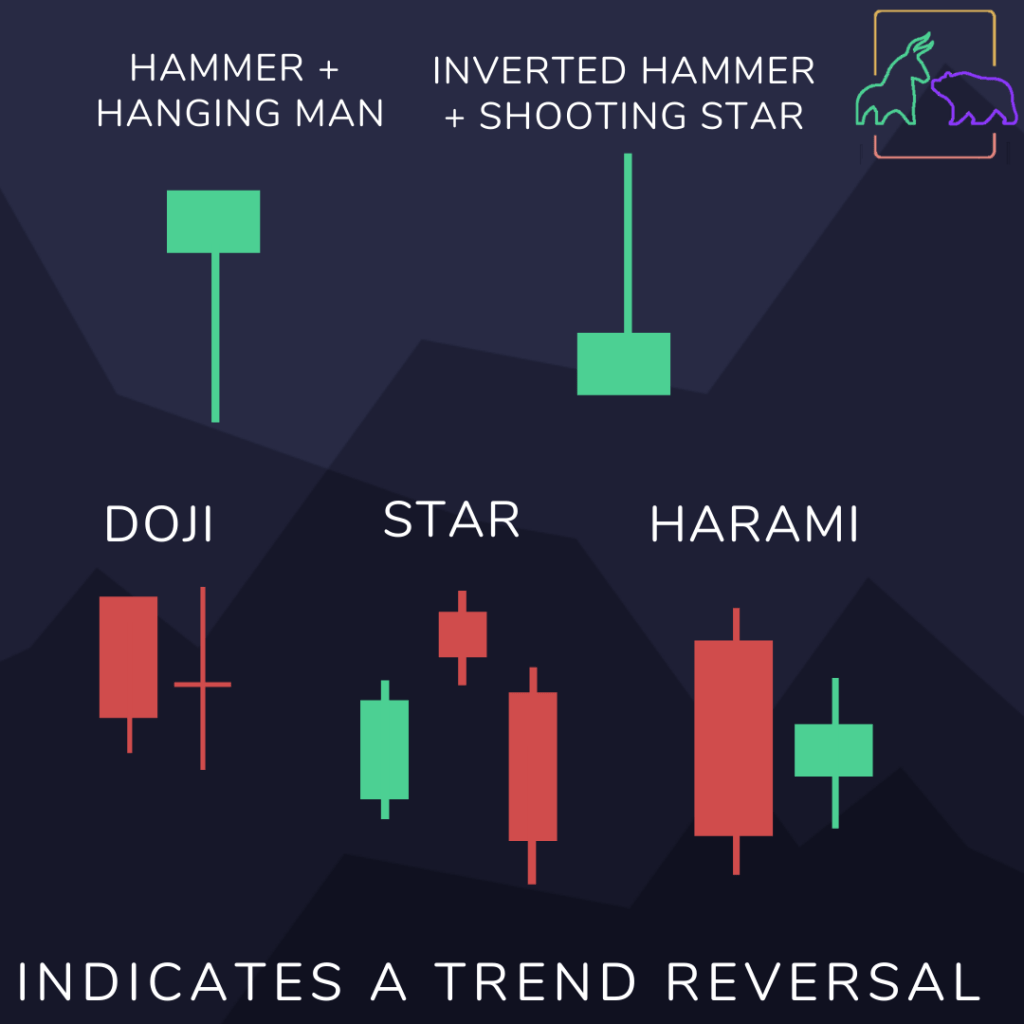
A star position is a candlestick that does not overlap with the previous candlestick and usually has a small body compared to the previous candlestick. The star appears isolating from the previous candlestick and can be above or below. Other special candlesticks like doji, hammers, shooting stars and spinning tops can feature in as a star position candlestick.
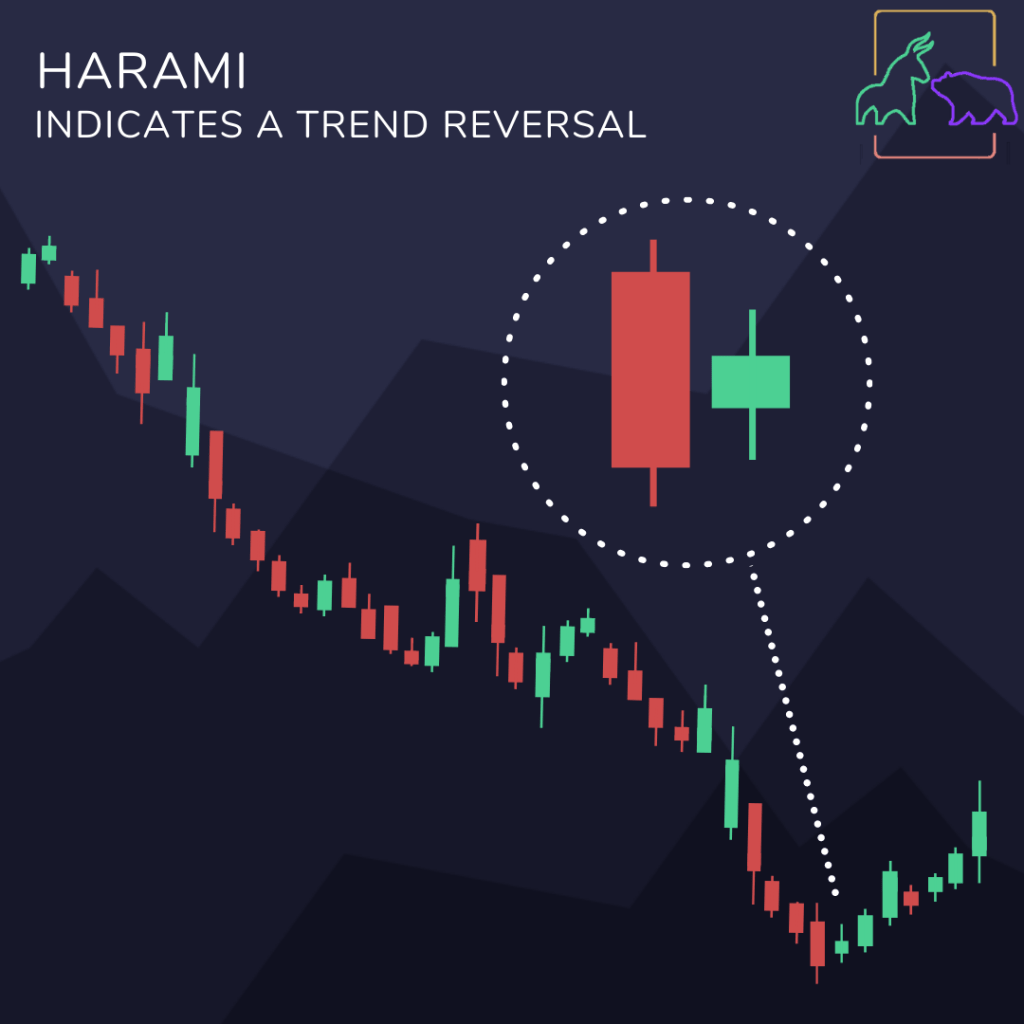
Similar to a candlestick position is a Harami position which has a long candlestick followed by a very short one. The word itself means pregnant in Japanese which makes this position easy to remember as the larger candle holds the little candle within it. After a long candlestick a short candlestick of the opposite pressure is present and should fit within the body of the larger candlestick, say a long green candlestick is followed by a short red candlestick.
Long shadow reversals
There are two pairs of candlestick reversal patterns which are made from a singlestick with a small body, one long shadow which is about double the length of the body and one very short shadow. One pair consists of the Hammer and the Hanging Man which are identical candlesticks with short bodies and long lower shadows whereas the second pair, the Shooting Star and Inverted Hammer have identical candlesticks but with small bodies and long upper shadows. The former pair mentioned appear after a long decline whereas the latter pair mentioned form after an upward trend.

The Hammer and the Hanging Man look the same but mean different things depending on the candlestick patterns that come beforehand. The Hammer indicates a bullish reversal after a decline or a support line. The long lower shadow demonstrates that sellers acted to drive down prices during the session before buyers took over to close the session. Although this seems like a clear indication of a reversal you should watch out for other signs to confirm this. For example, a gap up where there is no overlap between bodies of the current and previous candlestick or a long green candlestick. The opposite is the Hanging Man which can mark the turn to a bearish trend or the resistance line. Like the Hammer, you must look for confirmation in the form of a gap down or long red candlestick.

The Inverted Hammer and Shooting Star look the same yet depend on the surrounding candlesticks to present a full understanding of a change in the trend. Both candlesticks have small bodies, long upper shadows and very small lower shadows to make a trend reversal. The Shooting Star forms after an advance in the star position to mark a trend reversal or resistance line. These reversal candlesticks can be confirmed by a gap up or down or a long candlestick that follows. The Inverted Hammer looks the same yet forms after a decline or downtrend. The long wick shows a strong buying pressure was present during the session but couldn’t overcome the selling pressure. The bulls failed for a reason so look for confirmation before making a decision on it.
Before you invest with your new knowledge, you will need to open an account with a broker to manage your investments.
Choosing the best online stock broker can make the difference from an easy and exciting new experience to constant frustration and disappointment. Accessing financial markets through online brokers is easy and inexpensive but there are so many out there tailored to a different sort of customer so choose the right broker that will optimise your user experience and profits.
If you’re just starting out we recommend eToro and easyMarkets for their easy to use interfaces and fee – free trading.
Now you know the most common candlestick charts you can get started with trading! We recommend eToro and easyMarkets for beginners.

One thought on “Trading 101: Common Candlestick Patterns”